Creating programs for complex processes can sometimes lead to confusing program structures, especially when ArtiMinds RPS templates are organized across many levels of hierarchy. In order to keep track of the program, ArtiMinds has developed a function to visualize the program, named “Program to Visualization”! This allows you either to easily visualize the flow of individual program sections, i.e. sub-processes, and for example presenting them to your colleagues, or even to create an understandable overview of the entire program.
Our goal was to design a simplified flowchart that is understandable even for people who have never been in contact with our software, so that they can get an overview of the basic structure of the robot program.
STEP-BY-STEP INSTRUCTION
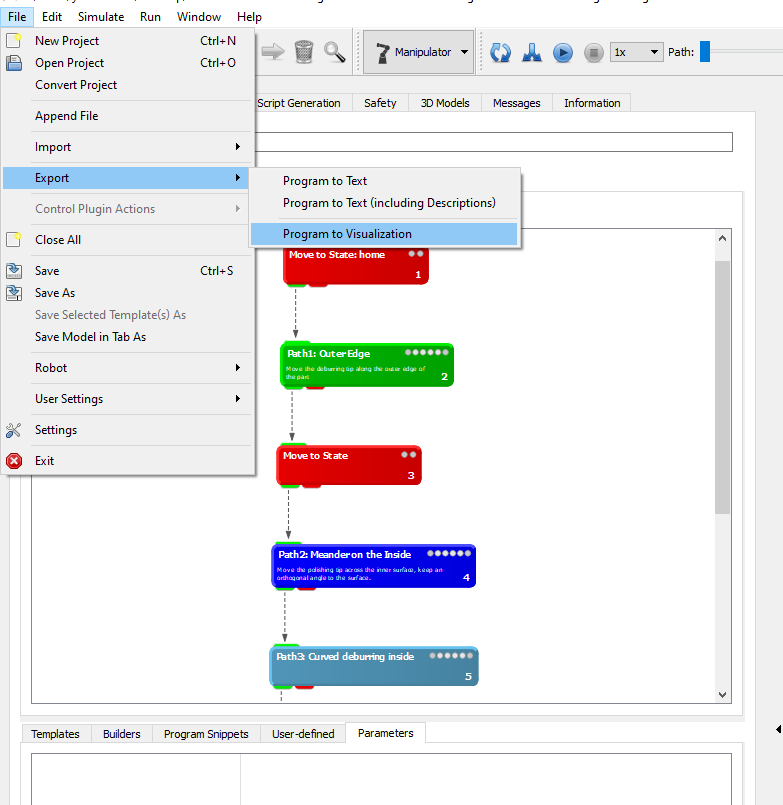
You have finished a program and want to create a transparent overview. First, select “File” -> “Export” -> “Program to Visualization” in the upper left corner.
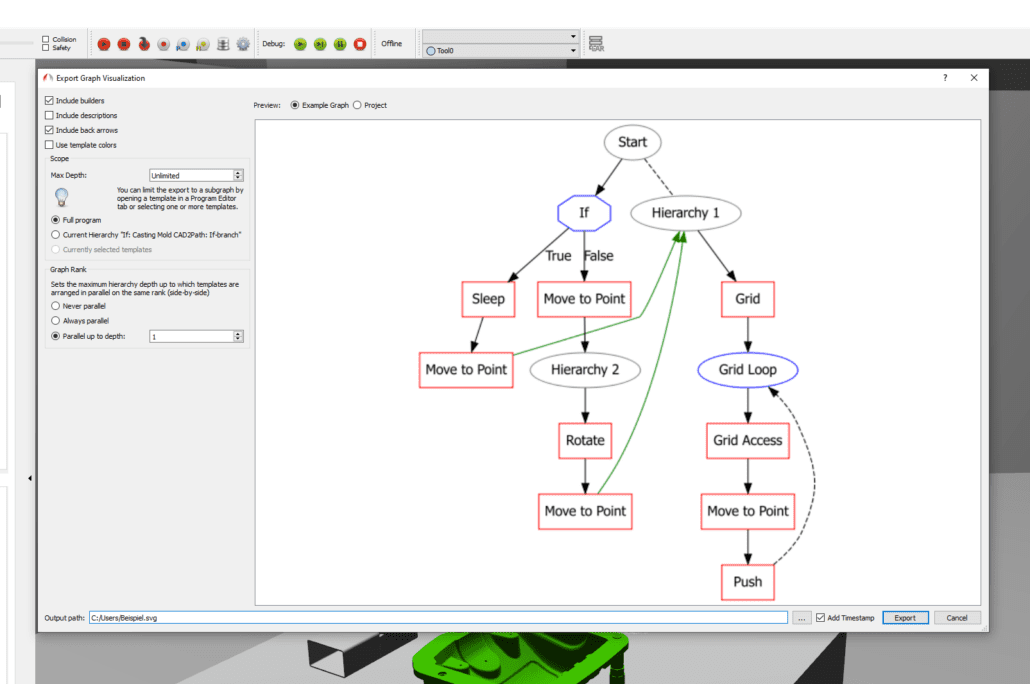
A window with different display options opens; you can select the options needed on the left hand side. First, you will see a sample graph on the right side.
The illustration on the right shows an example flow chart, by default with the setting “Example Graph” – i.e. an example project. Using the radio button above the visualization, you can select your individual “Project” to be used in the preview. At the very top left of the window, four checkboxes allow you to set the level of detail of the visualization:
“Include builder” – Not only templates will be visualized, but also builders (e.g. such as “Point”).
“Include description”– The description you specified in your template will be displayed in addition.
“Include back arrows” – Enable arrows pointing from the end to the beginning of a loop or to the next template following a hierarchy.
“Use template colors” – Each box uses the color of the templates you have defined in the Program Editor.
In the “Scope” section, you can decide whether you want to see the entire program or only specific hierarchies. Additionally, under “Maximum depth” you can specify to which hierarchy level you want to display the program:
Value 1: Show only the top program level
Value 2: Show the top program level and the contents of all hierarchies on this level
Value 3: Include the content of hierarchies that are placed in level 2, or infinitely deep.
Last, but not least, you can use “Graph Rank” to set whether individual hierarchies are displayed “always in parallel” (next to each other) or “never in parallel” (below each other).You can also restrict parallel display of hierarchies to an individual level.
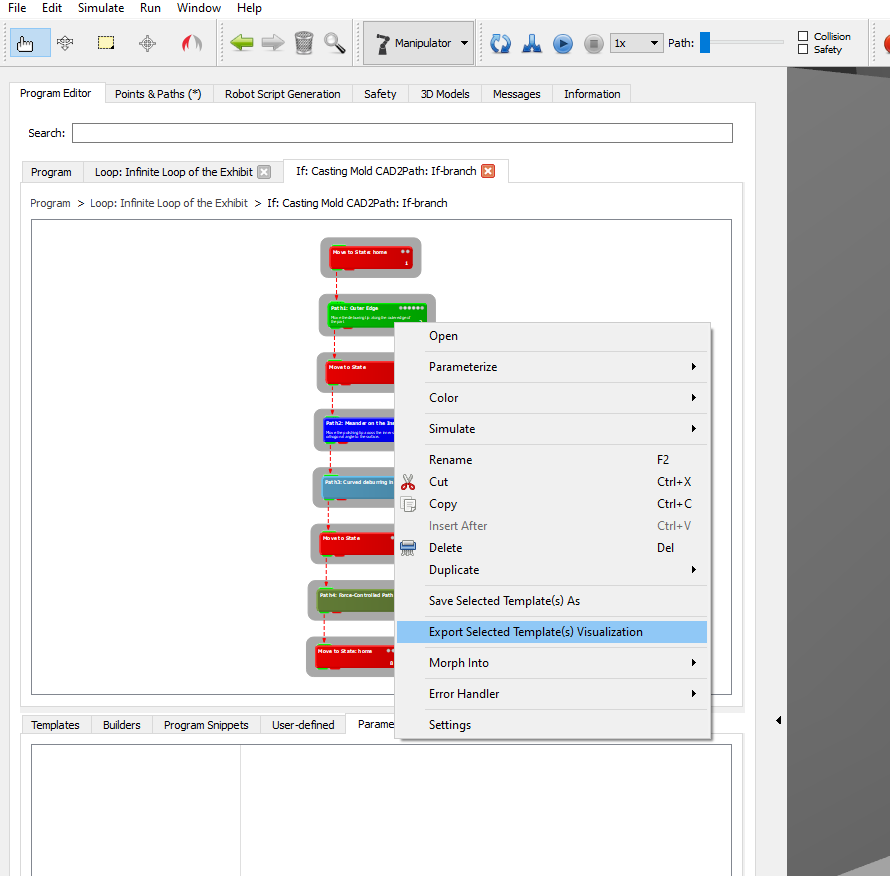
To quickly output the contents of a specific hierarchy as a visualization, you can also select all templates directly within a hierarchy in the Program Editor via CTRL + A and then open the visualization editor for exactly this hierarchy in the context menu via “Export Selected Template(s) Visualization” for graphical export of robot programs.
You can now save your file as image format (.png or .jpg), or as Scalable Vector Graphics (.svg).
Program and simulate robot applications independent of manufacturers, reduce maintenance costs and alleviate the lack of skilled workforces. Find out how ZF succeeds thanks to ArtiMinds!
We answer the most important questions about the ArtiMinds software solutions, applications and the company in our FAQ section.
In order to maintain high repeatability and process stability even for large quantities, Primus Präzisionstechnik automated the assembly of a gear unit using a flexible robot cell. The vision- and force-controlled application was programmed with ArtiMinds RPS.

